Troubleshooting with BrightForms Log Files
Contents Hide
BrightForms can be configured to log application activity to a log file through its Settings accessed via the system Help menu. This feature is highly beneficial in diagnosing unexpected behaviour in the application.
Using the different trace levels, for instance, the application flow can be traced, the SQL statements submitted to a database can be checked, or error log entries logged by BrightForms can be inspected to resolve the issues. The BrightForms log files are not only useful when debugging applications but also very handy when resolving the issues in a production system. If a field user is having an issue with his/her application, then capturing and checking the application log file will help you to address issues much quicker. These user log files on remote devices can be automatically received on the server side. Learn more about client logs.
 Note:
The higher the log level assigned for BrightForms, the longer it will
take processing expressions, due to the amount of information being
saved constantly to disk. For this reason, logging is initially turned
off in BrightForms' settings.
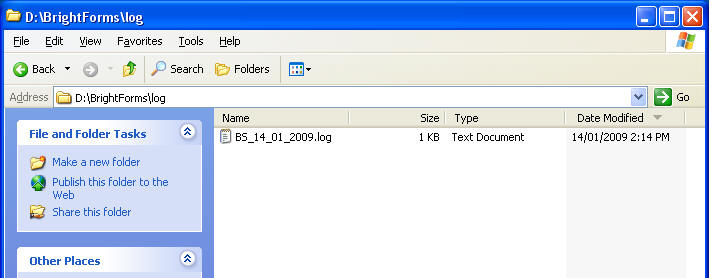
The log files are created in the log sub directory where BrightForms is installed, or the log sub directory in BrightForms' projects directory on iOS, Android and Modern Windows platforms. This directory normally does not exist and is only created by BrightForms when a new log files need to be created.

Trace Object
In addition to the built-in automatic log entries, using the Trace object in expressions, additional application specific log entries can be created. Using this object, different level of log entries can be log to the same log file along side to the system log entries.

