Remote Tracing
Contents Hide
BrightServer tracing log files are saved to [BRIGHTSERVER_DIR]\log directory. Server events can be used to examine server activity and determine server synchronisation, script or BrightWeb issues.
Live tracing of BrightServer events can be viewed from the Remote Tracing panel. To open Remote Tracing, expand an instance of BrightServer and double click Remote Tracing.
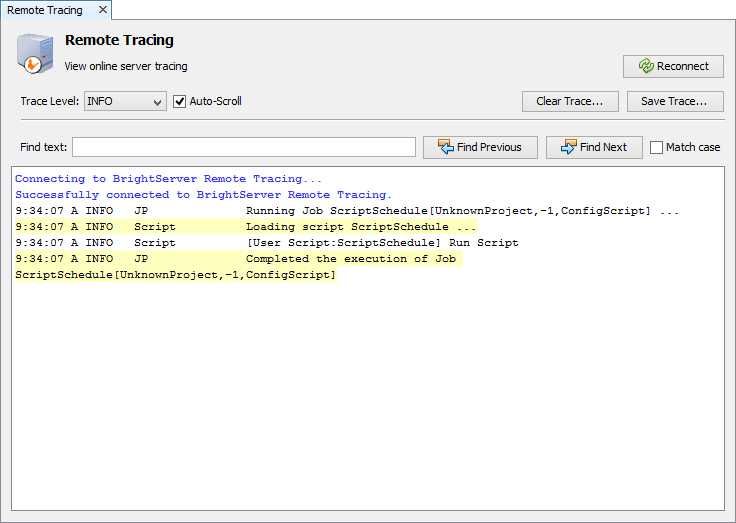
While the Remote Tracing panel is open, all events which occur on the server will be updated in the tracing window.
If a connection cannot be maintained to BrightServer during this process, a "server connection lost" dialog will display. In this state, the 'Reconnect' button may be tapped to attempt to resume the server connection.
The Remote Tracing Level can set set in order to filter tracing messages. Tracing levels in ascending order of verbosity are: FATAL, ERROR, WARN, INFO, DEBUG. If the Trace Level is set to DEBUG, then all server events will be displayed for all levelsi. By default, the Trace Level is set to INFO. To set the Trace Level, select the desired level from the drop-down box.
| Trace Levels | Description |
| Fatal | Errors that stop the application. |
| Error | Application failures (recoverable). |
| Warn | Warnings (e.g. low resources etc.). Application can continue to function. |
| Info | Detailed application operations. |
| Debug | All operations (e.g. exceptions, methods calls, function parameter values, return values, etc.). |
Text within this dialog may be saved to file, cleared or searched with the buttons provided.
 A higher Trace Level may cause slower server performance, particularly
during heavy server loads.
A higher Trace Level may cause slower server performance, particularly
during heavy server loads.