Reports
Contents Hide
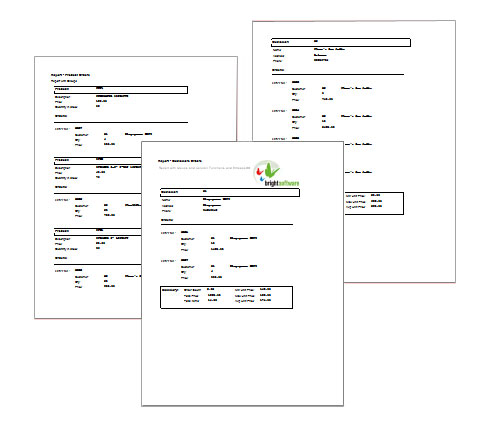
A report is an effective way to present your data in a printed format. Because you have control over the size and appearance of everything on a report, you can display the information the way you want to see it. Reports allow you to calculate totals, group records into categories and print selected data in an easy to read format.
Report creation and printing is supported only on the following BrightForms platforms : BrightForms Windows desktop edition, BrightForms Windows Mobile edition, BrightForms Android edition (Version 9 or later). Report generation is also supported by BrightWeb as HTML outputs.
The fundamentals of creating reports and forms are very similar. The layout tab is essentially the same. Controls have the same drag and drop interface and can be manipulated in the same manner as in a form. Also, each report is bound to a query and the resulting report data can be accessed in a similar fashion to the way form data would be used in a form.
Controls contain all the data that you want to display in a report. Controls include labels that display text, data fields that can have values assigned to them or lines and bitmaps that graphically organize the data and make the report more attractive.
Creating a New Report
In the Projects panel, expand the project in which the report is to be added. The different project elements will come into view.
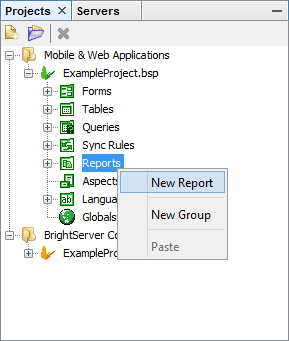
Right-click on Reports subtree and select New Report from the popup menu.
Expand the Reports subtree to verify the addition of a new report; it will also be automatically opened in the Source Editor window.
A new report will appear under the Report subtree with default name, Report1 or Report# depending on how many unnamed reports exist in the Reports subtree.
After creating a report, it is still possible to change any of the report properties like the report size; it can also be renamed to a suitable name that describes the nature of the report. If unsatisfied with the report or if its no longer wanted then it can simply be deleted.
Opening an Existing Report
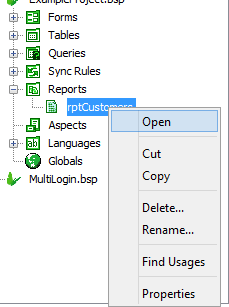
Existing reports can be opened for modification or to simply view the report characteristics. When a report is opened, it will dock itself to the Source Editor view. To open a report, do any of the following:
Double-click on the report name, OR
Right-click on the for report m name and select Open from the popup menu.
Changing Report Properties
Report properties can be changed to specify the size and title of a report. To change the properties or attributes of the form:
Select the report under the Project\ Report tree, the properties will be listed in the Filesystems-Properties window
Select the report property by clicking on the right hand side of the property name.
Type an entry or select from the options.
Report Properties
The following table is a list of the report properties and a brief description:
| Property | Description |
| Title | The title for the report. |
| Paper Width (mm) | The width of the report in millimetres. |
| Margin - Top | Margin for the top of the page in millimetres. |
| Margin - Bottom | Margin for the bottom of the page in millimetres. |
| Margin - Left | Margin for the left of the page in millimetres. |
| Margin - Right | Margin for the right of the page in millimetres. |
Renaming a Report
As mentioned earlier, it is recommended to have a consistent naming convention within the project. This is also true for the report. Name reports to describe what they do in the project. If Report1 displays customer data, it would be appropriate to rename Report1 to CustomerDataReport.
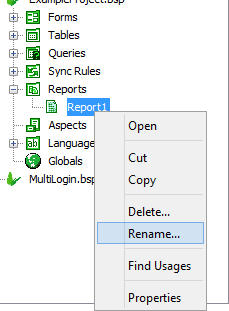
Here are the two ways to rename the report.
Double click on the name to make it editable, type the new name and press ENTER
Or, use the popup menu when right-clicking the name and select Rename, a Rename dialog box will appear. Enter the new report name in the New Name field and click Ok or press ENTER.
In the Rename dialog box below, the previous report name is displayed in the New Name field to allow users to append text to the word Report. This is true for all project element renaming.
 A valid report name begins with a letter and may be followed by
letters, digits, or an underscore sign '_', but must not
contain more than 64 characters.
A valid report name begins with a letter and may be followed by
letters, digits, or an underscore sign '_', but must not
contain more than 64 characters.
When an invalid name has been entered, BrightBuilder will issue a warning message like the one below and will not allow the form to be renamed; it will use the last valid name for the form.
Deleting a Report
The steps in deleting a form are the same in deleting a Project though instead of highlighting or selecting a project, an existing report must be selected. As a review,
Right-click on the report name.
Select Delete from the pop-up menu.
And confirm deletion by clicking Yes or pressing ENTER in the Confirm Object Deletion dialog box.
Report Layout and Controls
To create a report, first visualize how it should look and what data needs to be contained in the report. Think also about what headings and sections the report must include.
BrightBuilder uses drag and drop to place controls in the form layout. Control attributes can be modified to suit the application. With the different built-in functionalities, BrightBuilder makes it easy to use by providing the information; the user simply needs to choose from the list.
Multiple controls can also be selected and dragged, aligned or resized using the alignment and resize buttons at the bottom toolbar of the Report Layout tab.
Cut, copy and paste of report controls is also available with the project.
The report width and margins are editable in the report properties
to suit any type of document.
Report Controls
Here are the following lists of controls with a brief description of each available in BrightBuilder:
Labels for static text appearing on the report.
Data Fields query fields which can be assigned as report data, can either be text or binary.
Rectangles for creating lines and boxes.
Bitmaps for displaying images.
Adding a control to a report
Open the report to add a control to. The opened report will be displayed in the Source Editor window.
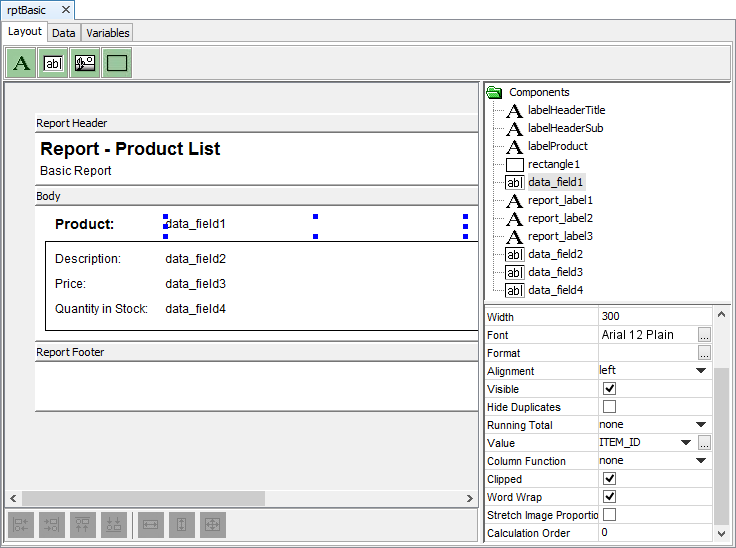
On the form Layout tab, click and drag the control icon onto the report. Once it is on the report, the control properties will be displayed in the Component panel. A new branch will also be added to the Components tree.
Using the Properties window set the properties of the control as required.
Changing form control properties using the properties list
Each report control has property settings that can be changed to alter the appearance or behaviour of these controls. These properties can be viewed and changed by using the Property Lists of a particular control.
Select the control name from the Components tree in the Component panel of the form Layout tab; properties will be displayed.
Set each form control property by clicking the right hand side of the entry and typing an entry or selecting an option.
Resizing report controls
Click on the control that needs to be resized in the report layout window.
Drag the sizing handles until the control is the size you want.
Use the resize buttons also to make multiple controls the same width, same height or same size.
Deleting a control
Select the control from the Component panel or report layout and press the Delete key, the Confirm Object Deletion dialog box will appear.
Click Yes to confirm deletion or Click No to cancel deletion.
Renaming controls
Double click on the control name in the Components tree until control name is editable.
Delete the default control name, type in the new name and press ENTER.
Report Control Properties
Label 
Labels are used in the report to display descriptive text such as titles, captions, or notes. The following table describes the properties for labels.
| Property | Default Value |
| Font | Arial 12 Plain |
| Caption | Label1 |
| Alignment | left |
| Clipped | false |
| Word Wrap | false |
Alignment
Choose from left, center or right to set the desired text alignment within the control.
Clipped
When this is set to true, any text that extends beyond the boundaries of the report control will not be visible. When set to false, all text regardless of the length of the text will be shown. This may cause it to overlap with other controls on the report.
Different fonts may also cause clipping. E.g. Italics may overextend the letters on the end of the text, over the right boundary of the control and cause a portion of a letter to be clipped. If this occurs then simply append a space to the text to be displayed.
Word Wrap
When this is set to true, any text that extends beyond the boundaries of the report control will be wrapped to form another line of text below. When Clipping is also set to true, the text will not extend beyond the height of the report control. When clipping is disabled, the text may continue down beyond the height of the report control depending on the length of the text. Also when clipping is disabled, any single word that is wider than the report width will be printed to extend over the edge of the report control.
Example: Word wrapping without clipping and with clipping.
Not Clipped (Left), Clipped (Right)
Data Field 
Data field are used in a report to display data. The following list the properties of an data field.
| Property | Default Value |
| Font | Arial 12 Plain |
| Format | |
| Alignment | left |
| Visible | True |
| Hide Duplicates | False |
| Running Total | None |
| Value | |
| Column Function | None |
| Clipped | false |
| Word Wrap | false |
| Stretch Image Proportionally | false |
| Calculation Order | 0 |
Hide Duplicates
When this is set to true, if the value contained in this data field in successive records is the same, only the first occurrence of that value will be printed.
E.g. If there were 3 consecutive records wherein a field named PRODUCT_ID was the same for all three records, a data field which was assigned PRODUCT_ID with Hide Duplicates set to True, would only show the first PRODUCT_ID value. For the next two records, the data field would not be printed. The report would print out something like:
| PRODUCT_ID | QTY | PRICE | CUSTOMER |
| PROD23 | 8 | 80.00 | John Doe |
| PROD23 | 6 | 60.00 | Jane Smith |
| PROD23 | 10 | 100.00 | Glen Jones |
Assignments
The Value property sets the data to be displayed in a data field. A field from the report query can simply be assigned to this field by selecting one from the drop down list. For each record, this data field will display the specified column value whether its a base64binary field or an integer field.
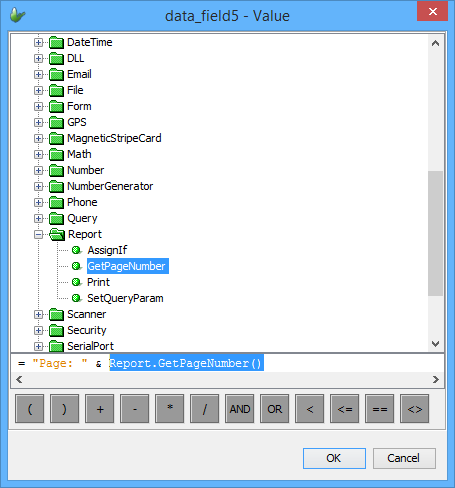
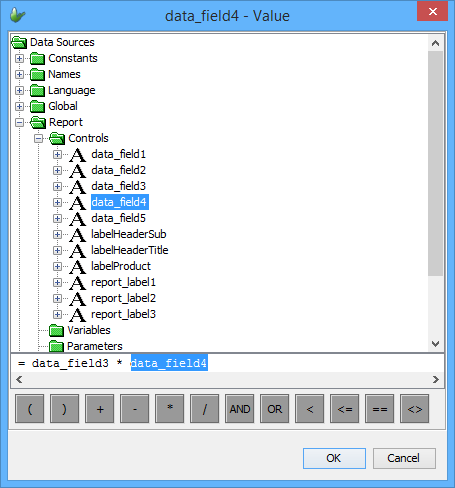
Otherwise, more complex assignments can also be made. Clicking on the button will open a window containing the Data Sources Tree. From there its possible to use the Data Source Tree and the operators to create an assignment equation by dragging and dropping them into the assignment box. For example, variables can be assigned, mathematical operations performed and so forth.
If the data is there then it can be manipulated in several different ways. Here are a couple of examples of possible assignments:
Assign the page numbers to a data field:
Multiply values contained in the report:
Stretch Image Proportionally
You can use the Stretch Image Proportionally property if the Value assigned to the data field is a base64binary column field. This allows the image to be displayed within the component without causing distortion.
Running Total
Data fields with running totals, total up all the records in a group or the entire report. Whatever value has been set to the data field will be accumulated with each occurrence of that data field. The Running Total property can be set to None, All or Group. When set to All, this data field will accumulate the value of the data field. When set to Group, the running total will be reset for each group.
This feature allows the report to display the total accumulate as it is calculated record by record, total a value independently of the reports grouping, total specific data values and complex assignments within a report, and so forth.
Group and All Running Totals
| Group: PROD34 | Running Total (Group) | Running Total (All) | |||
| Group: John Doe | Qty | Price | Customer | Total Price | Total Price |
| 20 | 200.00 | John Doe | 200.00 | 200.00 | |
| 30 | 300.00 | John Doe | 500.00 | 700.00 | |
| 8 | 80.00 | John Doe | 580.00 | 580.00 | |
| Group: Jane Smith | Qty | Price | Customer | Total Price | Total Price |
| 7 | 70.00 | Jane Smith | 70.00 | 650.00 | |
| 3 | 30.00 | Jane Smith | 100.00 | 680.00 | |
| Group: Glen Jones | Qty | Price | Customer | Total Price | Total Price |
| 4 | 40.00 | Glen Jones | 40.00 | 720.00 | |
| Group: PROD35 | Running Total (Group) | Running Total (All) | |||
| Group: John Doe | Qty | Price | Customer | Total Price | Total Price |
| 15 | 75.00 | John Doe | 75.00 | 795.00 | |
| 30 | 150.00 | John Doe | 225.00 | 1020.00 | |
| Group: Glen Jones | Qty | Price | Customer | Total Price> | Total Price |
| 2 | 10.00 | Jane Smith | 10.00 | 1120.00 | |
Column Functions
Column Function. Column functions include SUM, AVG, MIN, MAX, COUNT.
Sum Function - Returns the sum of a set of values contained in a specified field on a query.
Avg Function - Calculates the arithmetic mean of a set of values contained in a specified field on a query.
Min Function - Return the minimum of a set of values contained in a specified field on a query.
Max Function - Return the maximum of a set of values contained in a specified field on a query.
Count Function - Calculates the number of records returned by a query.
The data field will display the result of the column function. In the absence of any groups, the column functions will be applied to all the records in the query result associated with the report. If the data field is in a group header or group footer or a body section within a group header/footer, the calculations will be performed only on the records associated with that group.
This feature is useful when it necessary to find sub-totals, group totals, group averages, group min/max, and so forth.
Column functions in groups:
| Customer: John Doe | Qty | Price |
| Group: PROD34 | ||
| 20 | 200.00 | |
| 30 | 300.00 | |
| 8 | 80.00 | |
| Count: 58 | Total Price (SUM): 580.00 | |
| Group: PROD35 | ||
| 15 | 75.00 | |
| 30 | 150.00 | |
| Count: 45 | Total Price (SUM): 225.00 |
Rectangle 
Rectangles can be used to create boxes and lines and is an effective means of grouping or separating controls to improve readability. Rectangles can be resized to suit the situation. Rectangles can be used as vertical or horizontal lines by resizing the width to zero or the height to zero respectively.
| Properties | Default Value |
| N/A |
Bitmap 
The Bitmap control displays images on the report. It is necessary to take note of the image filenames that are used to load in the bitmap controls in all your BrightBuilder applications. It is recommended that unique filenames are used for all image files that will be used in all BrightBuilder projects. The following table describes the properties for Bitmaps.
| Properties | Default Value |
| Bitmap - Filename | |
| Stretch Image Proportionally | false |
Report Sections
A report is made up of the following sections:
Report header and footer.
Page header and footer.
Group headers and footers.
Body
All reports contain a body but can also include the other sections to suit the report design. Each section can be populated with any of the report controls. Bound controls can display data from report data and unbound controls can be used to label, group and organise data in a easy to read format. The length of each section can also be resized simply by dragging the bottom edge of the report section.
Each report is bound to a query. The records returned by the query, form the report data that can be manipulated and displayed in the report. A report need not contain all the fields from the result of the query that it is based on.
Body
The body is where most of the report data will be displayed. For each record contained in the report data (the records returned by the report query), a body section will be generated in the report. Consider the body to be like a template that each record will use to display its fields. Data fields can be used to display each record's fields.
Report Header and Footer
A report header and footer will appear once in the report at the start and at the end of the report respectively. This section would be most appropriate for report titles, summaries, dates and other general information.
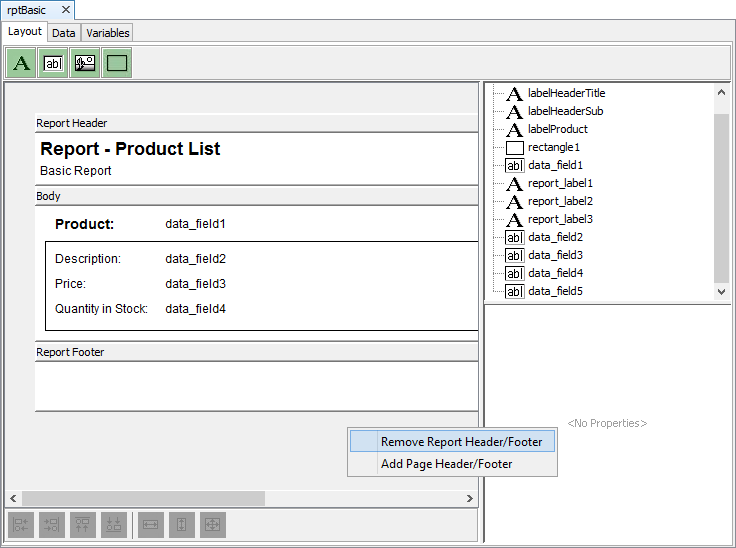
To add a report header/footer, right click the background in the Layout tab and select Add Report Header/Footer. To delete a report header/footer, follow the same procedures and select Delete Report Header/Footer.
Page Header and Footer
A page header and footer will be displayed on the top and bottom of every page of the report.This section can be used to display such data page headings, column heading, dates and page numbers.
To add a page header/footer, right click the background in the Layout tab and select Add Page Header/Footer. To delete a page header/footer, follow the same procedures and select Delete Page Header/Footer.
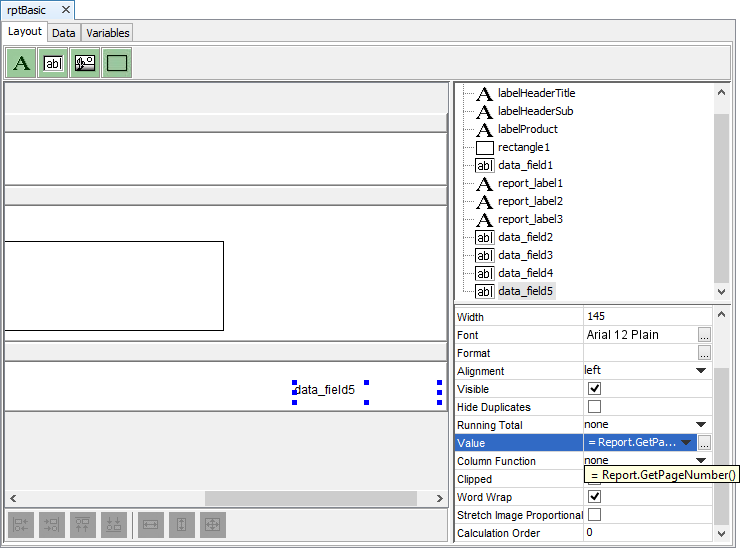
The page number can be printed in this section by means of assigning the Report.GetPageNumber() method to a data field in the page header or footer as shown below. The Report.GetPageNumber() can be found in the data source tree under Data Sources/Objects/Report.
Group Header and Footer
Groups can be created to categorise and organise data in an easy-to-read manner. A set of records may be split up into sections grouping identical values in a column. Groups can be nested into each other to create sub-categories. To see how to create groups, see the next section on report data.
Data
A query must be supplied to each report in the data tab of the report. The query supplies the record source for the report, to be displayed or loaded to the controls. Based from this logic, we say that the report controls are data bound to the record set of the query.
Groups
Groups can be formed according to one or more of the output fields of the query. For example, to view records based on product ID, you could group records by PROD_ID. You can also calculate totals and other values for each group. Common values of that output field in the report data will be grouped together within a group section in the report.
Records grouped by Product ID:
| Group: PROD34 | Qty | Price | Name |
| 20 | 200.00 | John Doe | |
| 30 | 300.00 | John Doe | |
| 8 | 80.00 | John Doe | |
| 7 | 70.00 | Jane Smith | |
| 3 | 30.00 | Jane Smith | |
| 4 | 40.00 | Glen Jones | |
| Group: PROD35 | Qty | Price | Name |
| 15 | 75.00 | John Doe | |
| 30 | 150.00 | John Doe | |
| 2 | 10.00 | Jane Smith |
To create a group, simply select the output field and click
on the ![]() button
to add it to the Grouping box.
button
to add it to the Grouping box.
Multiple groups can be created and these will become nested within each other according to the order they are placed in. Once this is done, the layout tab will have been updated with a new group header and footer.
Records grouped by Product ID and Customer Name:
| Group: PROD34 | |||
| Group: John Doe | Qty | Price | Name |
| 20 | 200.00 | John Doe | |
| 30 | 300.00 | John Doe | |
| 8 | 80.00 | John Doe | |
| Group: Jane Smith | Qty | Price | Name |
| 7 | 70.00 | Jane Smith | |
| 3 | 30.00 | Jane Smith | |
| Group: Glen Jones | Qty | Price | Name |
| 4 | 40.00 | Glen Jones | |
| Group: PROD35 | |||
| Group: John Doe | Qty | Price | Name |
| 15 | 75.00 | John Doe | |
| 30 | 150.00 | John Doe | |
| Group: Glen Jones | Qty | Price | Name |
| 2 | 10.00 | Jane Smith |
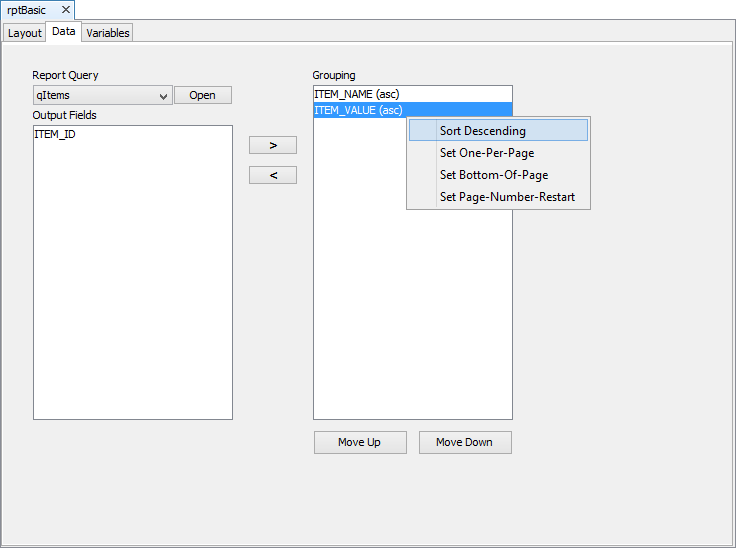
Groups are sorted in ascending order by default. Descending order can also be set by right-clicking on the output field and selecting Sort Descending. To revert the sorting back to ascending, simply select Sort Ascending as shown from the image above.
Groups can also be printed one-per-page by following the same procedure and selecting Set One-Per-Page.
The Set Bottom-Of-Page option allows you to print the group details at the bottom of the page.
While the Set Page-Number-Restart option resets the page number by group. Page number can now be set back to 1 after a group is printed.
To delete groups simply select the group and move it back to
the Output Fields box by clicking the ![]() button.
button.
 Warning: Deleting a group or changing the report query
will result in losing all controls that are contained in the
group headers/footers.
Warning: Deleting a group or changing the report query
will result in losing all controls that are contained in the
group headers/footers.
Variables
Similar to a form, reports can also have variables. The values in the variables can be used in assignments to data fields and are set from within a form with the Report.SetVariable() method.
Printing Reports
Reports can be printed by means of an expression in a form. Within the expression make sure that any query parameters have been set and all variables have been assigned the correct values.
Printing to Printer
Within an expression you will need to use the Print() method under the Report object. This method accepts a string argument which is the name of the report to be printed.
Report.Print("Basic")
You would assign this expression to a control (for example a button). Upon executing this expression in BrightForms the print dialog will appear allowing you to choose the printer to print. The following images display the Android print dialog. As seen on the Android platform a preview of the report is also available.
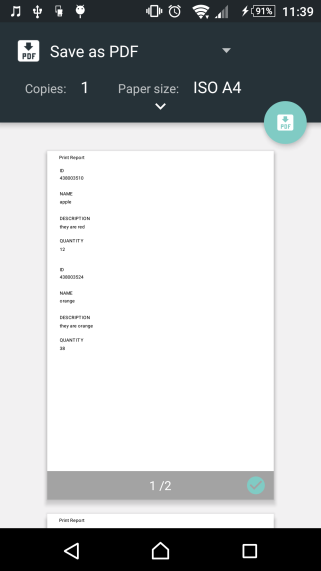
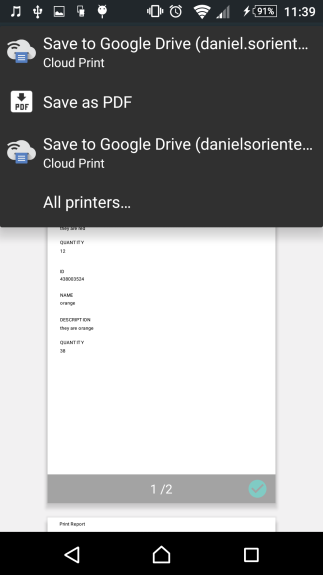
The above screenshots are examples only and can look different depending on the device. Print() returns an integer, 0 if it was successful otherwise it will return an error code. It is recommended to check what Print() returns to determine if the execution was successful.
Printing to PDF
You also have the option to print a report to a PDF and save it on the device. In order to do this, you will need to use the PrintToPDF() method within the Report object.
For example:
local.file = filepath_ctrl & “/” & filename_ctrl & “.pdf”
Report.PrintToPDF(“BasicReport”, local.file)
The PrintToPDF() method take in 2 arguments, the first being the name of the report to be printed and the second being a string that contains the filepath and filename for the PDF. Similarly to Print(), it is recommended to check the result of the PrintToPDF() method.
Examples
Example 1: Assigning a value from a combo-box to a query parameter associated with the report and printing the report.
custid = combo_box1.GetCurrentRowColumnValue("CUST_NO")
Report.SetQueryParam("pCustID", custid)
Report.Print("Headers")
Example 2: Assigning a value to a query variable associated with the report and printing the report.
Report.SetVariable("ReportCaption", edit_control2)
Report.Print("VariablesAssignments")
Example 3: Printing two copies of the report and not displaying the print dialog.
Report.SkipPrinterDialog(true)
Report.SetCopyNumber(2)
Report.Print("Basic")
Troubleshooting
Incorrect font being printed out or incorrect sizes being printed out.
Printing on different devices will not always produce identical printouts due to device specific variations. E.g. PocketPC devices may not contain all the fonts that the report was designed with. In such cases, the font will be defaulted to one that is available on the device resulting in the report looking different. Therefore it is recommended that the report is test printed on the device on which the application is to be deployed and run.
Text not displaying or elements missing from report or not printing at all.
Please make sure that printing preferences are correctly configured. Check printing preferences such as the printer name, port, colour scheme, paper size and network connectivity.
Page margins not printing as expected.
Page margins will differ depending on the device from which the report is printed from. The differences between PDA devices and desktop devices can sometimes be very dramatic. Therefore it is recommended that the report is test printed on the device on which the application is to be deployed and run.
Running Totals on headers/footers don't show correct values.
Running Totals are designed to be used only in body sections. Totals in headers and footers can be obtained by other means such as column functions or assignments.