Application Debugging
Contents Hide
The BrightXpress Mobility Suite provides debugging for expressions, allowing developers to pause the execution of expressions at any point, and observe the state of the expression while it is paused. The values of variables and other data sources may be observed and even modified by developers, thus allowing them to identify and trace an application’s execution with greater ease and efficiency.
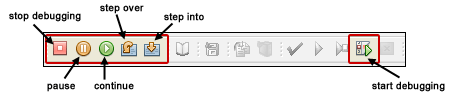
Debugging in BrightBuilder is centred on the concept of setting breakpoints, and navigating through expressions with the Debugging Toolbar, pictured below.
The following sections will describe how to set up and debug an application, and monitor changes to its data sources.
 Debugging is currently only available for the desktop version of BrightForms.
Navigating Through Expressions
The debugging session is started using the Debug Button [] in BrightBuilder, which will execute BrightForms with debugging activated. The application will run as normal until a breakpoint is reached. The developer may also manually pause the application using the Pause button [] in BrightBuilder.
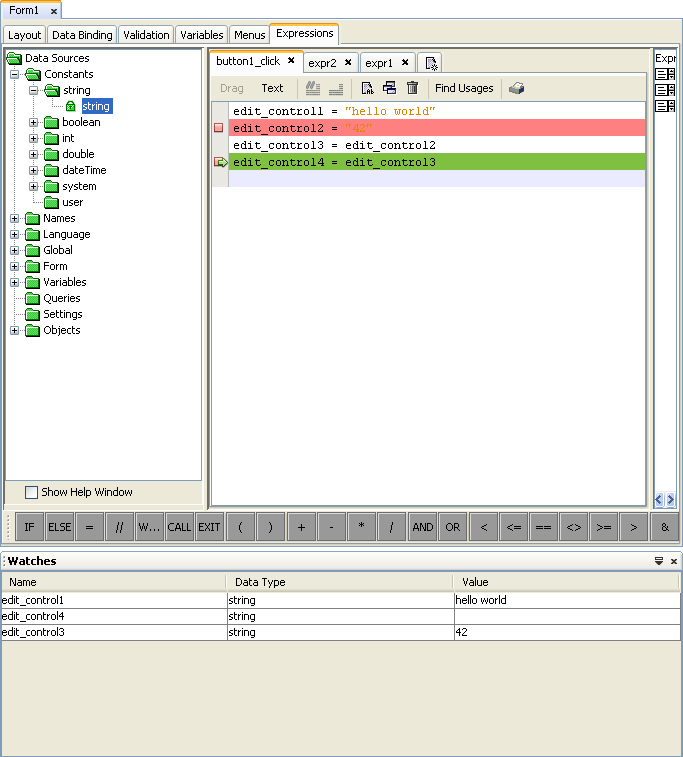
Once paused, either manually or via breakpoint, BrightForms will halt all operations until prompted otherwise. In this paused debugging state, the application’s current expression may be navigated through, using the debugging panel. The current line in the expression will be displayed and highlighted in green in Expressions panel in BrightBuilder.
 Stop
Stop
Debugging in BrightBuilder may be stopped at any time either by using the ‘stop’ button [] or closing BrightForms manually, provided an expression isn’t in the process of being stepped through. If BrightForms is terminated during the stepping process, BrightBuilder will terminate the debugging session and notify the user.
 Pause
Pause
The Pause button is used to manually pause BrightForms. BrightForms will pause in the same way as for an expression.
 Continue
The Continue button becomes accessible in the paused state. When pressed, the application will continue until another break point is reached, or until the expression’s execution is complete.
 Step Over
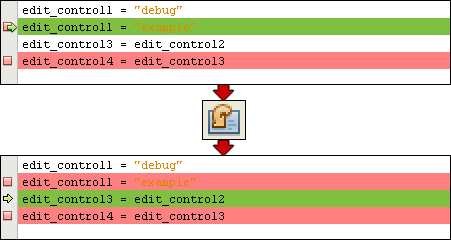
The “Step Over” button progresses to the next line within the current expression. If the last line of an expression is reached, the step function will leave the expression and BrightForms will then run normally at full speed.
 Step Into
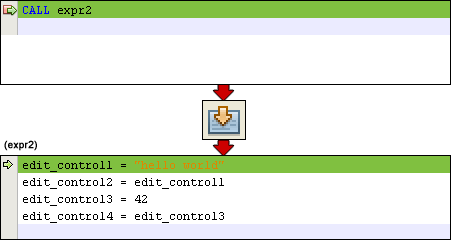
The “Step Into” button becomes accessible when the currently paused line in the expression is a CALL statement. When pressed, the execution will move the execution to the first line in the expression that is being called, and BrightBuilder will display the new current expression.
Breakpoints
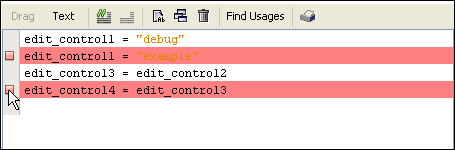
Breakpoints automatically trigger a paused state in the debugging session when they are reached in BrightForms. Breakpoints may be set in Drag mode in the Expression Editor. To set a breakpoint, click inside the grey line down the left side of the code. The line will become highlighted in red, and the [] icon will be displayed on the left column. Breakpoints may be set and removed before and during the debugging session.
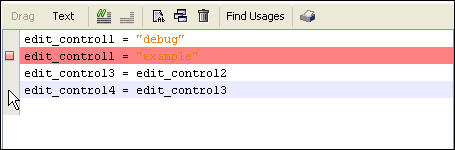
Below is the cursor before setting the breakpoint.
Once clicked, the breakpoint is set, highlighted by the red line.
Breakpoint locations are saved between BrightBuilder sessions.
Watching Data Sources
The Watches panel may be accessed through the Window > Watches option. Alternatively, when a breakpoint is reached, the watches panel is automatically displayed. The Watches panel is used to see the values for writeable data sources such as controls, variables and parameters, given the context and point of execution in an expression.
The values for each of the data sources in the Watches panel may be changed when the application execution is paused.
Adding Watches
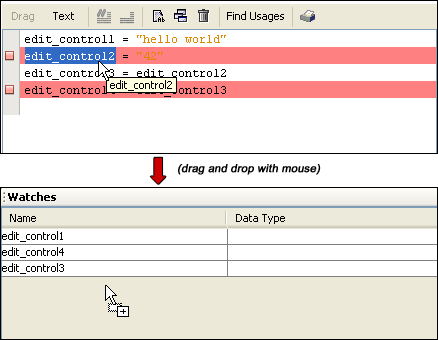
Any data source which can have a value assigned to it can be added to the Watches window and subsequently observed and modified. To add a data source, drag and drop it either from the expression in drag and drop mode, or the data source tree.
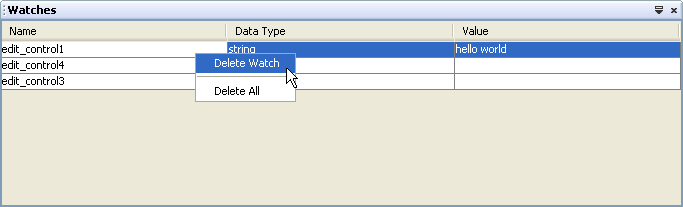
Deleting Watches
Deleting a data source may be achieved by right clicking on it and selecting delete. Alternatively, the source may be selected and the delete button may be pressed to remove it. Multiple data sources may be selected and deleted using this method. All data sources may be deleted via the ‘delete all’ option in this context menu.
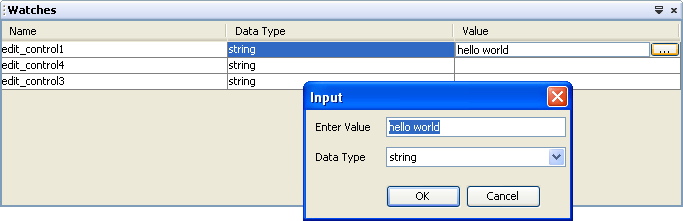
Changing Watched Values
Values can be changed by clicking on the field and editing it. If the value’s type needs to be changed, the ellipsis located next to this field may be clicked, and a dialog box will appear allowing changes to be made.
Scope of Watched Sources
As watching variables depend on context, if a context is not present, ie, if an expression isn’t currently being stepped through, the values for them will be recorded as <No current context>.
As a form only has access to a certain set of data sources, if they are not within the scope of the expression called, the values will be recorded as ‘Unable to access data source’.
Debug Panel
To assist the debugging process, BrightBuilder provides the Debug Output panel which helps track the execution of the project in BrightForms. During a debugging session, the Debug Output panel will display everything that BrightForms sends to its own log file, in real time.
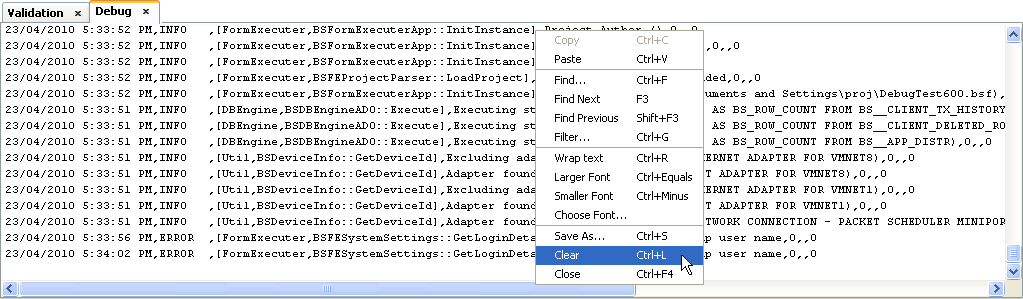
The Debug Output panel may be searched, filtered, stored or cleared via Right-Clicking and accessing the context menu.
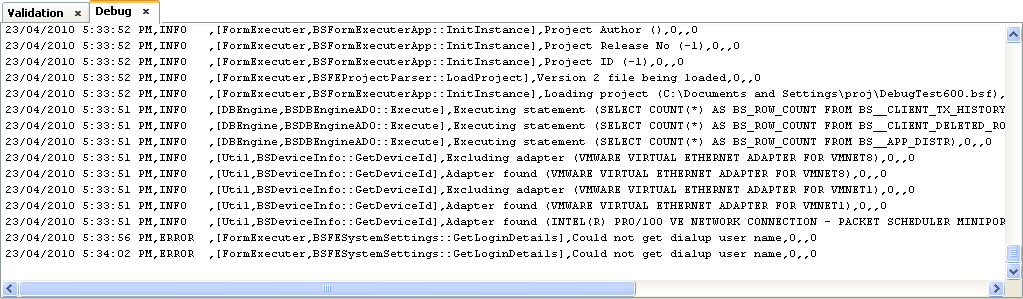
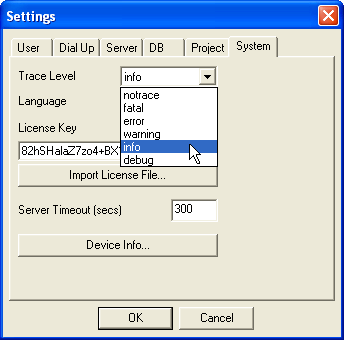
The Debug Output panel may be manually displayed using the Window > Debug menu. BrightForms also triggers the opening of the panel when in debug mode if its trace level is info or higher in its Settings > System tab.
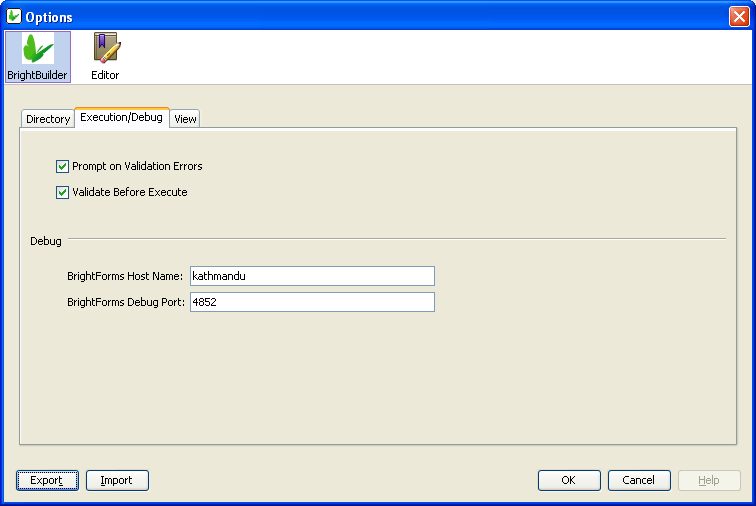
Advanced – Configuring Debug Ports
In order to debug an application, BrightBuilder communicates with BrightForms via TCP/IP ports. This port is 4852 by default, and can be configured in the BrightBuilder and BrightForms settings. BrightBuilder will connect with BrightForms via TCP/IP using the specified host and port when the debugging button is pressed.
If there is an error setting up this debugging connection, please ensure that this host and port are accessible by BrightBuilder and BrightForms through the settings menu. It is also advised to remove all connected mobile devices if this problem persists, as the connection may interfere with local host name resolution. If somehow "localhost" or machine name cannot still be resolved, then try using the raw IP address in the host name field, for example, 192.168.40.22.